


Using ngspice with Kjwaves
What is Kjwaves ?
Kjwaves is a frontend for spice3 simulators written in Java using NetBeans andruns on any platform where you can install 1.5 release of Java virtual machine. Kjwaves can be used as a simple plotting program to display the content of a spice RAW file or as a complete frontend to the simulator.
You can use Kjwaves to load and edit a spice netlist, spawn a spice process and display the results, modify it and resimulate. Output graphs can be saved or printed.
Installing Kjwaves
Using ngspice with kjwaves is easy, first you need to install a Java virtual machine, version 1.5 or higher. On most operating systems you may skip this step since a java virtual machine has already been installed. If not, look for an 1.5 virtual machine suitable for your platform. Once done with Java you have to download Kjwaves.
Now unzip the package and follow installation instructions. In the following example a working installation of kjwaves is assumed.
Example:
In this example we will run Kjwaves to analyze a differential pair. The corresponding netlist is:
difpair ckt - simple differential pair vin 1 0 sin(0 0.1 5meg) dc=0 ac=1 vcc 8 0 12 vee 9 0 -12 q1 4 2 6 qnl q2 5 3 6 qnl rs1 1 2 1k rs2 3 0 1k rc1 4 8 10k rc2 5 8 10k q3 6 7 9 qnl q4 7 7 9 qnl rbias 7 8 20k .model qnl npn(bf=80 rb=100 ccs=2pf tf=0.3ns tr=6ns cje=3pf cjc=2pf + va=50) *.width in=72 .opt acct list node *.tf v(5) vin *.dc vin -0.25 0.25 0.005 *.ac dec 10 1 10ghz .tran 5ns 500ns .print dc v(4) v(5) .plot dc v(5) .print ac vm(5) vp(5) .plot ac vm(5) vp(5) .print tran v(4) v(5) .plot tran v(5) .end
First we start kjwaves with the following command:
user@host:~$ startKJWaves
If Kjwaves is installed correctly, then the main window will appear.
Now we load the netlist from "File" menu with "Open SPICE circuit". If the netlist loads without errors, the main windows should be filled with netlist data like the one below:
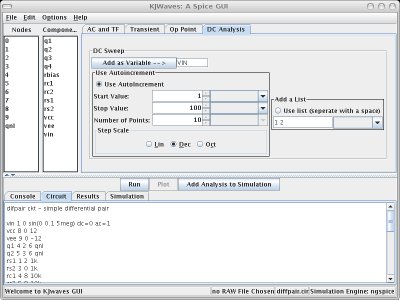
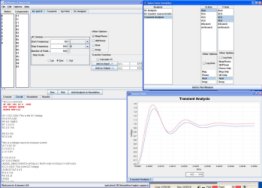
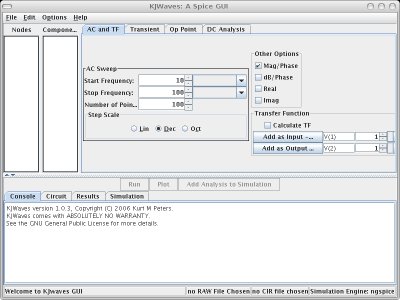
Starting from top left, you can see the two listboxes, containing the list of node names in the circuits and the list of components. The tabbed panel on top right allows users to define new analyses (not all analyses available to ngspice are supported yet). The lower part of the window is occpupied bya a tabbed panel where you can look at the netlist ("circuit" tab), or check the interaction with the simulation engine ("console" and "simulation" tabs).
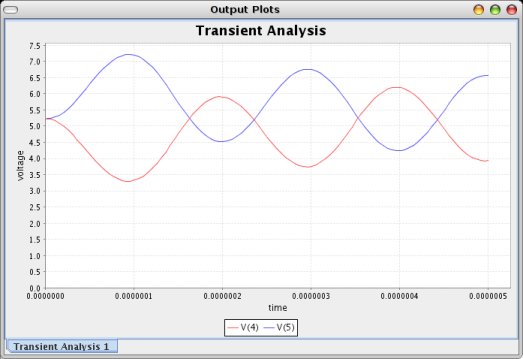
To run the transient anaysis specified in the netlist press the "run" button over the bottom tabbed panel. Kjwaves will ask you about saving the output file and then will ask you about reloading it, answer "Yes" to both requests. A new window should appear where we will select the vectors to plot. Note that we can plot simple functions of one or two vectors.
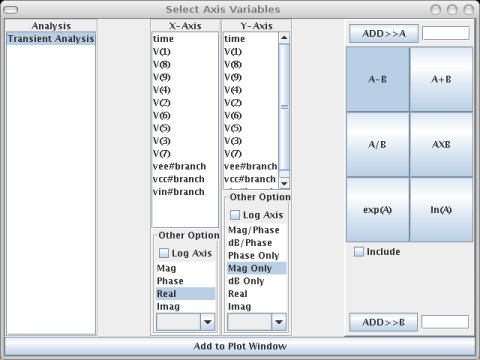
We choose "time" as X-axis variable and both V(4) and V(5) as Y-axis variables. Then we press "Add to Plot Window" and the desired plot comes up:
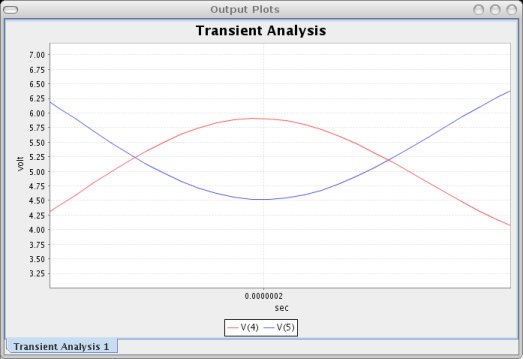
It is possible to zoom one area of the plot:
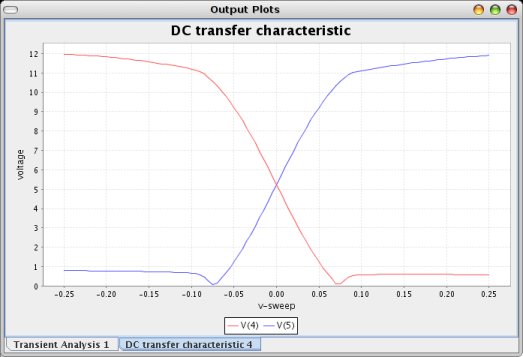
Ok, we have made our first simulation with Kjwaves. Now we will modify the netlist from the "circuit" tab" in the main window. For example uncomment the dc analysis and rerun the circuit. As always, anser "Yes" to the requesters. In the window where we select the axes variable, a new voice appears in the listbox at the left. Now we have two different analyses. Choose "DC transfer characteristic" and "v-sweep" for X-axis and V(4), V(5) for Y-Axes. You should get the following plot:
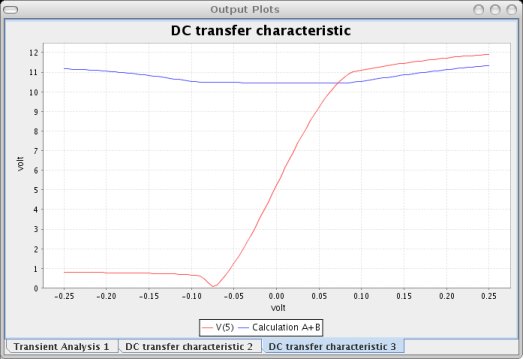
We can plot the sum of vectors v(4) and v(5) like in the picture below:
That's all! Happy playing with Kjwaves.
